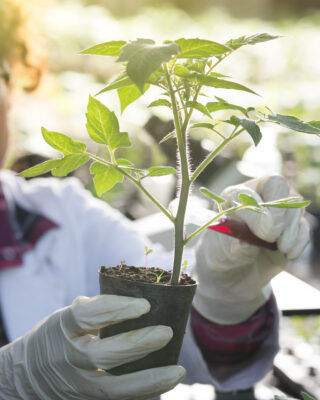
Advancing innovation in agriculture for a sustainable future
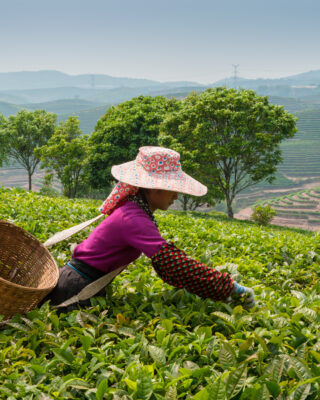
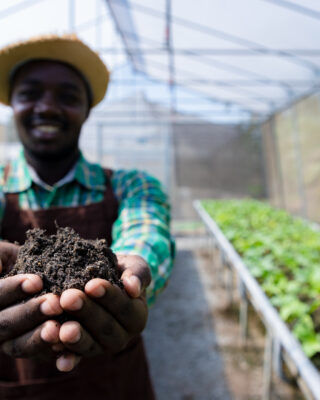
As a global advocate for the plant science industry, CropLife International champions innovative technologies that enable farmers to sustainably increase productivity while managing the critical challenges facing our climate and the environment.